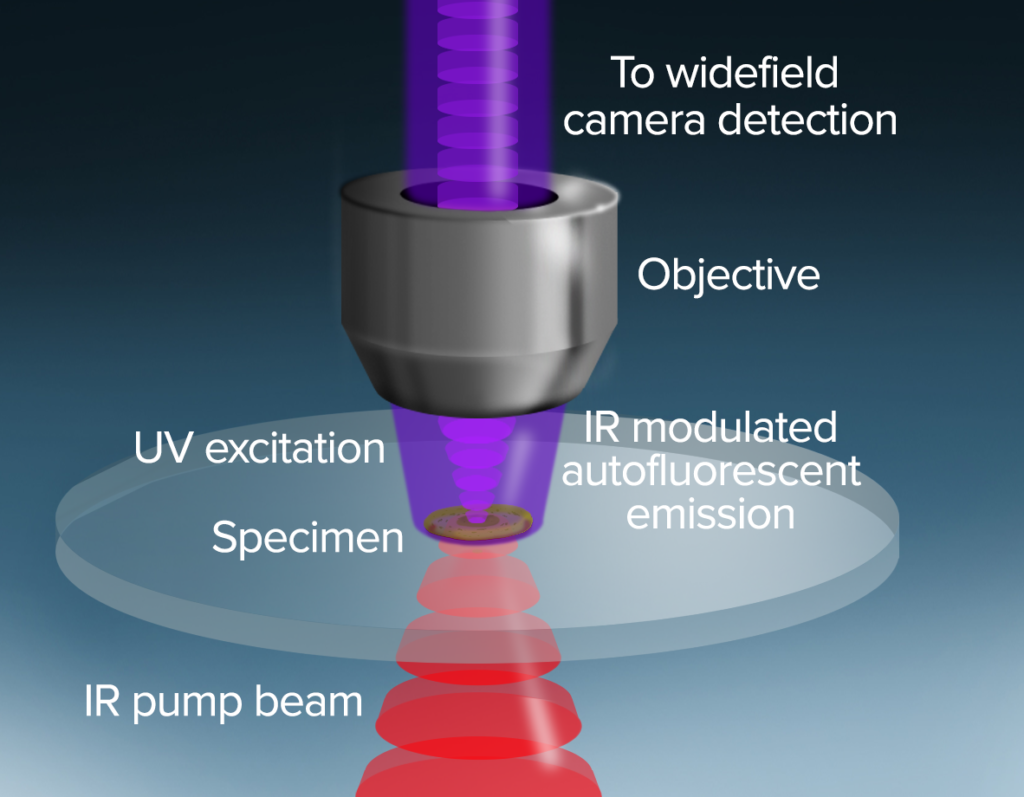
"I am very excited about new possibilities that
can now be achieved with fluorescence guided
OPTIR on the mIRage-LS for biomedical
research. The new instrument offers a dream
setup for microspectroscopic experiments."
Oxana Klementieva, Ph.DAssociate Professor, Lund University, Sweden 
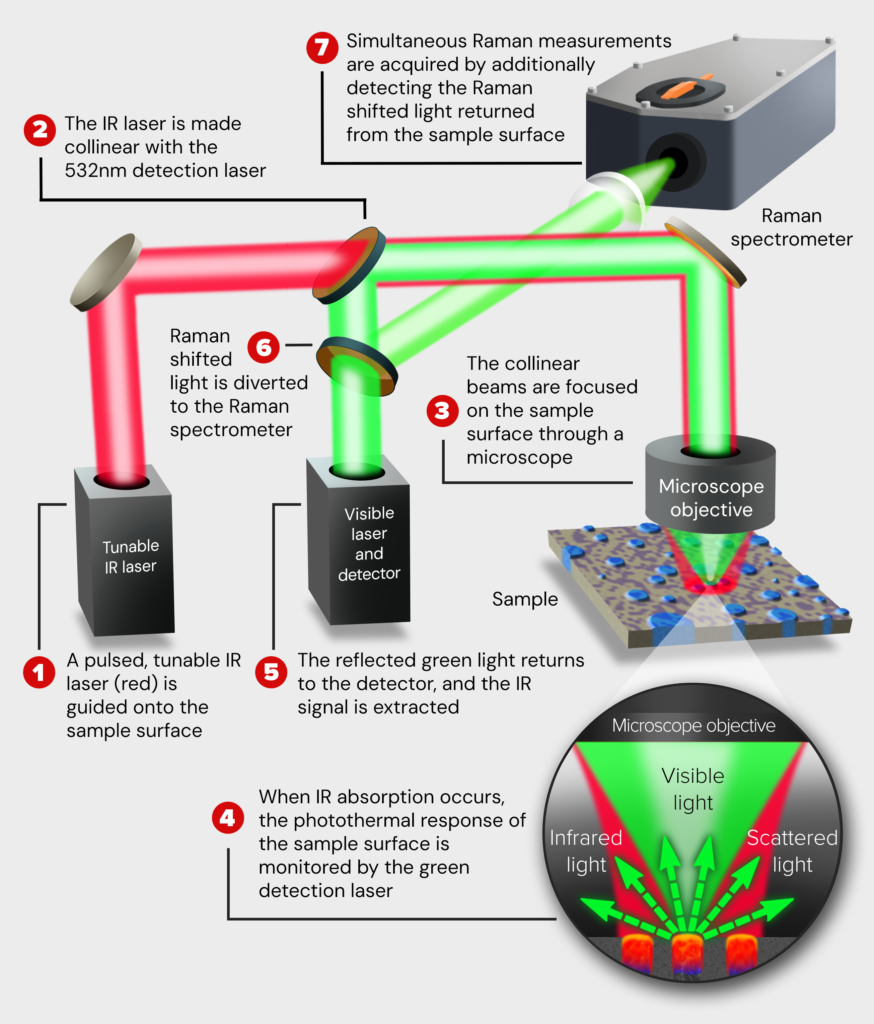
“The capability of the mIRage system to provide submicron simultaneous IR+Raman is truly unique and offers significant advantages compared to other technologies. Moreover, Photothermal team have been amazing to work with!”
Tanya Hutter Ph.DAssistant Professor The University of Texas at Austin 
“Our first user experiment in the field of Alzheimer’s went so well that the researchers are submitting a manuscript to a high impact journal. The OPTIR is a disruptive technology.”
Ferenc Borondics, Ph.DPrincipal Beamline Scientist SOLEIL synchrotron France 
“mIRage is truly extraordinary. Within weeks of installation we finished measurements for our first paper. It should be called the ‘mIRacle‘! “
Agnieszka Banas, Ph.DSenior Research Fellow Singapore Synchrotron Light Source (SSLS)